Your computer’s Central Processing Unit (CPU) is its brain, constantly working to handle tasks. Like any hardworking component, it generates heat. Knowing how to check your CPU temperature is crucial for maintaining performance, preventing overheating damage, and even diagnosing potential issues.
Why CPU Temperature Matters
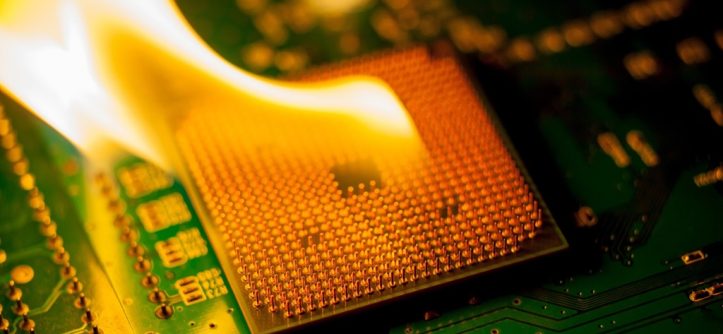
A CPU operating at high temperatures can throttle its performance to protect itself, leading to slowdowns, crashes, or in extreme cases, permanent damage.
Monitoring your CPU temperature allows you to:
- Ensure optimal performance: High temperatures often lead to reduced performance as the CPU tries to cool itself.
- Prevent damage: Excessive heat can degrade the CPU’s lifespan.
- Diagnose issues: Abnormal temperature readings can indicate problems like failing fans, inadequate cooling, or even overclocking instability.
Ways to Check Your CPU Temperature
Several methods exist to check your CPU’s temperature, ranging from simple built-in tools to comprehensive software solutions:
- BIOS/UEFI:
- What it is: The BIOS (Basic Input/Output System) or UEFI (Unified Extensible Firmware Interface) is your computer’s firmware, accessible during startup.
- Pros: Provides a basic temperature reading at idle (when your computer is not under heavy load).
- Cons: Doesn’t show real-time temperatures under normal use, and requires restarting.
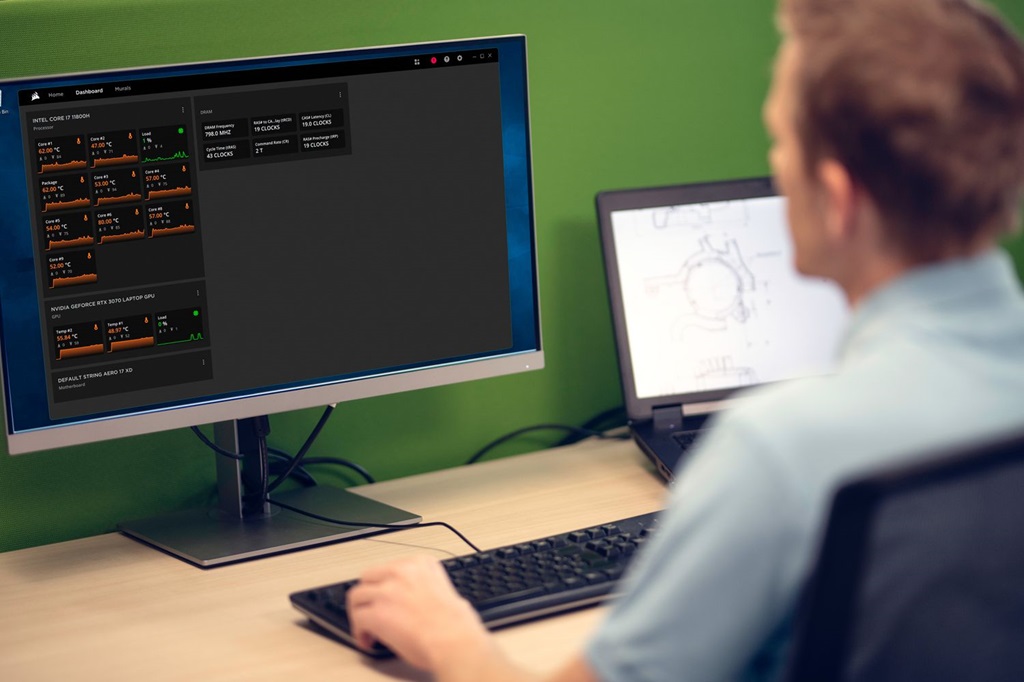
- Third-Party Software:
- What it is: Specialized software designed for monitoring hardware temperatures.
- Pros: Offers real-time monitoring, and often includes additional features like fan control, stress testing, and logging.
- Cons: Requires installation, some options may have a learning curve.
Popular Software Options:
- Core Temp: A lightweight, no-frills tool focused solely on CPU temperature monitoring.
- HWMonitor: A simple yet effective tool that displays temperatures for various components, including the CPU.
- NZXT CAM: A modern software suite with a sleek interface, offering comprehensive system monitoring and customization options.
- Open Hardware Monitor: One exemplary open-source solution for monitoring hardware components and temperatures is the Open Hardware Monitor. This software offers detailed insights into the performance and health of various hardware elements, such as CPU, GPU, and hard drives.
Users can easily track temperature fluctuations, fan speeds, and voltages in real time. It provides valuable data for maintaining optimal system conditions and preventing overheating issues. For instance, when wondering about normal CPU temperature while gaming, check out https://greateryellowstonescience.org/what-is-the-normal-cpu-temperature-while-gaming/ to understand the expected ranges and ensure their system is operating within safe limits.
Related: UNDERSTANDING YOUR PC’S INTERNAL WORKINGS
Choosing the Right Tool
The best tool for you depends on your needs:
- Casual users: If you just want a quick check, the BIOS/UEFI might be sufficient.
- Gamers or power users: Dedicated software like Core Temp or HWMonitor is recommended for real-time monitoring during intense tasks.
- Enthusiasts: NZXT CAM or Open Hardware Monitor offer deeper insights and customization for those who want complete control.
Understanding Temperature Readings
What’s a “good” CPU temperature? It depends on the CPU model and workload. Generally:
- Idle: 30-50°C is normal.
- Gaming or heavy load: 60-80°C is acceptable, but lower is better.
- Max temperature: This varies depending on the CPU, but exceeding 90-100°C can be dangerous.
Additional Tips
- Check your manufacturer’s specifications: Find out the recommended temperature range for your specific CPU model.
- Clean your computer regularly: Dust buildup can hinder airflow and increase temperatures.
- Ensure proper ventilation: Avoid blocking your computer’s vents and consider adding additional fans if necessary.
- Overclocking: If you’re overclocking your CPU (running it faster than its default speed), be extra vigilant about monitoring temperatures.
Important Note: If your CPU temperature consistently exceeds safe limits, investigate the cause. It could be a failing fan, dust buildup, or a more serious issue.
Let me know if you’d like a deeper dive into any of these methods or software options!


Leave a Reply